Hi all.
Can someone help me to solve problem about time axis?
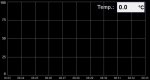
On Y axis I need to show some values from microcontroler, and on X axis I need time values as "HH:mm".
So on X axis I need time when data is collected from controller. That time is every 10 minutes, so the intervals on xaxis is also 10 minutes and range is one hour (that is visible). I need functionality to scroll X axis because the full range is 24 hour.
I can draw graph if that can hel you.
THANKS!
Can someone help me to solve problem about time axis?
On Y axis I need to show some values from microcontroler, and on X axis I need time values as "HH:mm".
So on X axis I need time when data is collected from controller. That time is every 10 minutes, so the intervals on xaxis is also 10 minutes and range is one hour (that is visible). I need functionality to scroll X axis because the full range is 24 hour.
I can draw graph if that can hel you.
THANKS!