plot chart using excel range

alokmpatel

Member
Joined
Dec 20, 2014
Messages
6
Programming Experience
Beginner
Hello all,
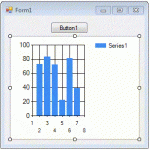
i have form1 in vb.net in which i have a button1 and chart1.

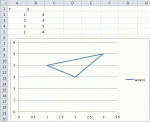
what i want is to plot chart1 in vb.net as its as in excel. (with xy scatter with x range named as "cx"--(A2:A5), and y range named as "cy"----(B2:B5)

Thanks for support.
Alok
 

Attachments

  • form1.GIF
    form1.GIF
    21.3 KB · Views: 36
  • excel.GIF
    excel.GIF
    16.5 KB · Views: 35
You can get data from Excel as array using automation like shown here: How to automate Excel from Visual Basic .NET to fill or to obtain data in a range by using arrays
Other methods to get data can be with OleDB.

You can then loop array and add data points to the Chart.Series, or in some cases use data binding.

A simple example:
Imports Excel = Microsoft.Office.Interop.Excel

        Dim app As New Excel.Application
        Dim book = app.Workbooks.Open("C:\path\book.xls")
        Dim sheet As Excel.Worksheet = book.Worksheets.Item(1)
        Dim range As Excel.Range = sheet.UsedRange

        Dim data(,) As Object = range.Value

        For row = data.GetLowerBound(0) + 1 To data.GetUpperBound(0)
            Dim x = data(row, 1)
            Dim y = data(row, 2)
            Me.Chart1.Series(0).Points.AddXY(x, y)
        Next

        book.Close()
        app.Quit()
 
Thanks JohnH,
Its working perfect for one series. but i am facing one more problem. i have to plot number of series in one chart.
and for all the series is it possible to get data from maned range?? instead of calling from row and column number.

series 1:
x range= (A2:A5)
x range name= "x_1"
y range= (B2:B5)
y range name= "y_1"

series 2:
x range= (A8:A12)
x range name= "x_2"
y range= (B8:B12)
y range name= "y_2"

in addition of above i have axis control. max and min value for x and y axis from excel cell range.

max x value in cell = A15 (name: max_x)
min x value in cell = A16 (name: min_x)
max y value in cell = B15 (name: max_y)
min y value in cell = B16 (name: min_y)


by this i can also set axis min and max value.

Thanks once again for help.
Alok
 

Attachments

  • chart__.GIF
    chart__.GIF
    22.2 KB · Views: 32
Last edited:
sheet.Range("A2:A5") and sheet.Range("x_1") notations can be used.

For single dimension data you can also use databinding (even if array for interop must be two-dimensional), example:
        Dim x1(,) As Object = sheet.Range("x_1").Value
        Dim y1(,) As Object = sheet.Range("y_1").Value
        Me.Chart1.Series(0).Points.DataBindXY(x1, y1)
 
Back
Top