Zedgraph individual barItem color

bretddog

Member
Joined
Oct 5, 2008
Messages
12
Location
Norway
Programming Experience
Beginner
Hi!
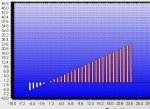
I'm plotting values as barItem along horizontal axis. I would like to color the bars like this:

1. Gradient color on each bar, and
2. Red if negative value, green if positive

The closest I've come is the advice in this link: Multi-Colored Bar Demo - ZedGraphWiki

However, it seems like this will not not give me the functionality I wish. I'm able to restrict the color to a certain range by making the max-min range very small, but then everything below that range are just white bars..

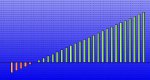
Is there any way to color and fill each single bar individually? It seems to be a pretty basic effect to have a positive and negative color, so I hope this is possible.
 

Attachments

  • ScreenHunter_072.jpg
    ScreenHunter_072.jpg
    101.6 KB · Views: 120
hmm.. looks like I solved it..
VB.NET:
 Public Sub AddBars(ByRef arrY As Array, ByRef arrX As Array, ByVal col As Color, ByVal size As Integer)
        Dim barIt As BarItem

        barIt = Me.pane.AddBar("New Bars", arrY, arrX, col)

        Dim colors As Color() = {Color.Red, Color.Yellow, Color.Green}

        Dim colFill As New Fill(colors)
        colFill.RangeMin = 0
        colFill.RangeMax = 0.1

        barIt.Bar.Fill = colFill
        barIt.Bar.Fill.Type = FillType.GradientByY
 

Attachments

  • ScreenHunter_073.jpg
    ScreenHunter_073.jpg
    42.5 KB · Views: 110
Hi again.. 2 years later.. My earlier project was dropped, but now I'm back and looking to get the hang on ZedGraph. So I'm faced with a similar problem as described above.. Basically, I now want to fill a color inside a curve, with green/red for positive/negative values. It seems like I managed this for a bar chart earlier, by having 3 colors, FillType.GradientByY, and make the range so narrow that the middle color doesn't show. Now, I would hope this would also be possible for a curve plot. However so far I'm not able to...

Attached image shows what I want to achieve.. So what shall I do to make this dual color? My code related to this is shown below, but it seems there is no response to what I put in the RangeMin/RangeMax values.. The colors simply split the overall range evenly in 3..
?

EDIT: I've now understood how the GradientByZ works, for bar charts, by specifying z as the desired number in the color array. However this I can neither make work for the curve fill..?

VB.NET:
     Dim curve As LineItem
        Dim myPane As New GraphPane

        curve = myPane.AddCurve("Curve 1", ySeries, Color.Black, SymbolType.None)
        curve.Line.Width = 1.0F

        Dim colorFill As New Fill(Color.Green, Color.Yellow, Color.Red, 90)
        colorFill.RangeMin = 0
        colorFill.RangeMax = 0.1

        colorFill.Type = FillType.GradientByY
        curve.Line.Fill = colorFill

        Me.ZgcTest.GraphPane = myPane
 

Attachments

  • 03.10101.gif
    03.10101.gif
    3.7 KB · Views: 104
Last edited:
I gave this a test and was not able to find a proper solution, but you could use same middle color as backcolor in order for the gradient to be less obtrusive. RangeMin/RangeMax didn't seem to have any effect.
 
Have you had any luck with solving this? I am running into the same issue.
Like John mentioned, the ranges or GradientByZ/X/Y seem to have no effect. Could this be a bug?
Do you know if the ZedGraph project is still being maintained?
Have you looked at any other alternative plotting libraries?
 
Hi,

No I didn't get it to work, but didn't investigate it any further. I may need it now soon though..

One way I think is to split your data series into two plots, one for negative and one for positive values, with the removed ones being set to 0 in each series. Of course, not so convenient..

I just thought it was strange a color-by-y-value feature was not available. Doesn't look like zedgraph is being maintained, last version 2008. I haven't tried any other charting components. Haven't found any free ones of similar feature set and lightweight package..
 
I want draw a horizontal bar with two solid colors. I used GradientByX but it does not set range correctly. And I get two gradient colors instead of two solid colors. Anyone knows how if it is a bug in gradientByX, gradientByY and gradientByZ?
 
Hi Bretddog,

I want to have horizontal bars with two colors, which is similar to which you have above. The difference is that each bar in my case should have two colors. But I found that I cannot get this to work. Can you please help with the code:

Private Function GraphBar(ByVal strLabel As String, ByVal value As Double,
ByVal change As Double, ByVal bcolor As Color) As CurveItem
Dim barIt As BarItem
Dim gp As GraphPane = gcBar.GraphPane
Dim arrayValue() As Double
Dim barColor As Color()
Dim temprange As Double
barColor = {bcolor, bcolor, Color.Green}
arrayValue = {value}
temprange = value - change
barIt = gp.AddBar(strLabel, arrayValue, Nothing, Color.Transparent)
Dim colFill As New Fill(barColor)
barIt.Bar.Fill.Type = FillType.GradientByX
barIt.Bar.Fill.RangeMin = temprange
barIt.Bar.Fill.RangeMax = temprange + 0.1
barIt.Bar.Fill = colFill
Return barIt
End Function


Thanks!
 
Back
Top