Ok, so here comes a real noob question from me. I have been working with mscharts for learning purposes for almost 5 hours, but cannot do this simple little task.
I have a dataset with 3 columns
Date
Area
Hours
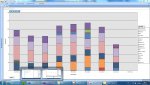
I want mschart to display a stackedbar with the date at the bottom, and have 1 bar pr date which is splitted in different colors. I have been using Access/VB6 for years now and this task is ridiculous simple for me in Access and a bit frustrating with VB.NET and Mschart.
This is my code so far:
This is probably something i would laugh of in the future, but now i feel kinda desperate and confused after 5 hours with googling, trying and mostly failing. Please help :=)
I have a dataset with 3 columns
Date
Area
Hours
I want mschart to display a stackedbar with the date at the bottom, and have 1 bar pr date which is splitted in different colors. I have been using Access/VB6 for years now and this task is ridiculous simple for me in Access and a bit frustrating with VB.NET and Mschart.
This is my code so far:
VB.NET:
Dim myConnection As SqlConnection
Dim myCommand As SqlCommand
Dim Dr As SqlDataReader

myConnection = New SqlConnection(ApologiDoseSQLreader)
myConnection.Open()
myCommand = New SqlCommand("SELECT Dato, Område, SUM(Timer) AS Timer FROM dbo.[LOG Arbeidsplan] GROUP BY Dato, Område HAVING (Dato > CONVERT(DATETIME, '2011-06-22 00:00:00', 102)) ORDER BY Dato DESC", myConnection)

Dr = myCommand.ExecuteReader(CommandBehavior.CloseConnection)

Chart1.DataSource = Dr
Chart1.Series("Series1").ChartType = SeriesChartType.StackedArea100

Chart1.Series("Series1").XValueMember = "Dato"
Chart1.Series("Series1").YValueMembers = "Timer"
Chart1.Series(0).XValueType = ChartValueType.Date

Chart1.DataBind()

Dr.Close()
This is probably something i would laugh of in the future, but now i feel kinda desperate and confused after 5 hours with googling, trying and mostly failing. Please help :=)