terrv
New member
- Joined
- Dec 14, 2010
- Messages
- 1
- Programming Experience
- Beginner
Hi everyone,
I'm quite new to using the chart control and need some help. I have a DataGridView on a windows form which show the number of bookings for each event. The data is actually returned from a web service that I produced too.
On this form I would like to have a bar chart representing the data present in the DataGridView. I can get the data from the web service to my VB client without any proble in this Gridview but I just don't know how to make the chart work, in relation to the data present in the DataGridView. Here's some code for the two buttons on the form; one to populate the DataGridView and the other to populate the chart. Only the DataGridView button works, but when I click the button for the chart nothing happens.
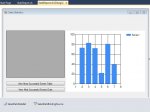
I have attached a screenshot of VS2010 IDE with this form open. The code above belongs to this form.

Can anyone help? Thanks in advance.
Thierry
I'm quite new to using the chart control and need some help. I have a DataGridView on a windows form which show the number of bookings for each event. The data is actually returned from a web service that I produced too.
On this form I would like to have a bar chart representing the data present in the DataGridView. I can get the data from the web service to my VB client without any proble in this Gridview but I just don't know how to make the chart work, in relation to the data present in the DataGridView. Here's some code for the two buttons on the form; one to populate the DataGridView and the other to populate the chart. Only the DataGridView button works, but when I click the button for the chart nothing happens.
VB.NET:
Imports System.Data.DataSet
Imports System.Data
Imports System.Data.Sql
Imports System.Data.SqlClient
Imports System.Collections.Generic
Imports System.ComponentModel
Imports System.Drawing
Imports System.Linq
Imports System.Text
Imports System.Windows.Forms

Public Class frmStatsReport

    'a new instance of the service
    Private serv As New BhpService.ServiceSoapClient
    'new instance of stats dataset
    Private ds As New BhpService.SalesStats
    'another instance for the sales chart
    Private dschart As New BhpService.SalesStats


    Private Sub btnStats_Click(ByVal sender As System.Object, ByVal e As System.EventArgs) Handles btnGridStats.Click
        'wait curssor
        Me.Cursor = Cursors.WaitCursor()
        'merge the dataset with the actual data
        ds.Merge(serv.ViewSalesStats())
        Try
            'get the datasource
            grdStats.DataSource = ds.BookingsTableAdapter
            grdStats.Columns(0).ReadOnly = True
            If grdStats.RowCount() > 0 Then
                MessageBox.Show("Those are the sales figures for each booked event", "Sales Report", _
                                MessageBoxButtons.OK, MessageBoxIcon.Information)
            End If
        Catch ex As Exception
            MessageBox.Show("There are no statistics to report", "No Report", _
                            MessageBoxButtons.OK, MessageBoxIcon.Information)
        End Try
        Me.Cursor = Cursors.Default()
    End Sub

    Private Sub Button1_Click(ByVal sender As System.Object, ByVal e As System.EventArgs) Handles btnChartStats.Click

        Dim dtable As New DataTable()
        dtable = SalesStatsDataSet.BookingsTableAdapter
        chtStats.DataSource = SalesStatsBindingSource
        chtStats.Series("Series1").XValueMember = dtable.Columns(1).ToString()
        chtStats.Series("Series1").YValueMembers = dtable.Columns(0).ToString()
        chtStats.DataBind()
        chtStats.Visible = True
    End Sub
End Class
I have attached a screenshot of VS2010 IDE with this form open. The code above belongs to this form.

Can anyone help? Thanks in advance.
Thierry
